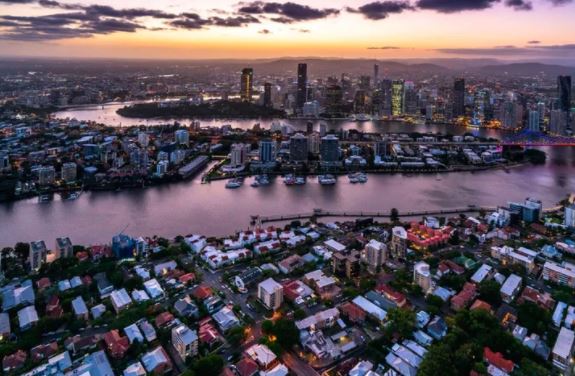
A surge of Australians looking to buy a property has seen prices soar in Brisbane suburbs over the past two years.
Property prices have hit record highs this year and, despite the effects of Covid19 recent Domain Research shows median prices rose annually 5.6% in Brisbane houses.
Of course such broad city wide generalisations are not very helpful has while some areas are booming, others are being left behind in the dust.
The Domain research found that by mapping price movements at a suburb level, the priciest suburbs tend to lead the property cycle.
For a closer look, let’s break the data down.
But note that only house data is included in Domain’s research. This means some inner-city suburbs are not featured in the maps because their housing stock is dominated by units.
Brisbane
Suburb with the biggest price increase: Thorneside (28.5%)
Suburb with the steepest price fall: Burpengary East (8.4%)
Changes in Brisbane property prices over the past two years
Brisbane: Mapping the market over COVID
Houses
During the height of Covid-19, Brisbane’s housing market defied the odds, shone through, and even came out relatively unscathed.
By the end of 2020, Greater Brisbane’s property price median hit a new record high of $616,387, which is $28,000 above the previous record set in early 2020.
House prices have risen modestly over each quarter of the 2020 calendar year, rising a further 0.8% over the December quarter to end the year 5.6% higher than the last.
Dr Nicola Powell, Senior Research Analyst at Domain explained:
“First-home buyers became active utilising incentives and low mortgage rates became the norm.
Upsizing buyers were enticed by cheaper credit and altered their wish-lists to think more about property characteristics such as space and lifestyle, rather than commute time and distance to the CBD.
The rising interest from interstate buyers and the movement of residents from regional Queensland into Greater Brisbane will continue to support demand. Outer suburban and lifestyle areas will be the main beneficiaries.”
March 2019: The slowdown
Brisbane house prices were close to a peak in March 2019, up 1.1 per cent year-on year to $571,738, a fraction lower than the high reached mid-2018. Up to this point, house prices had roughly six years of continuous annual growth.
Across Brisbane, 62 per cent of houses recorded positive growth at this time, and 7 per cent of suburbs mapped recorded double digit price growth. The biggest growth in suburbs came from suburbs of Hamilton, Burpengary East, Robertson and North Ipswich. Growth patterns were widely dispersed across Greater Brisbane.
June 2019: The first annual decline since 2012
By June 2019, Brisbane had recorded its first annual decline in house prices since mid-2012, contracting 0.2 per cent to $568,558. More suburbs began to record an annual decline in median house price. At this time 40 per cent of suburbs recorded a price drop, a rise from last quarter.
Despite falling house prices in Greater Brisbane, 58 per cent of mapped suburbs recorded a price rise. Brisbane suburbs leading the way in price growth included Chelmer, Balmoral, Gundale and Windaroo. Of the suburbs with negative price growth, Teneriffe, Fig Tree Pocket and Chuwar recorded price falls of more than 15 per cent. Once again growth patterns were widely dispersed across Greater Brisbane.
June 2020: The COVID hit
Brisbane largely avoided price falls seen in Melbourne and Sydney. The prosperity in suburb house prices is highlighted by the fact that 67 per cent of suburbs mapped in our analysis had increased, a slight rise from the previous quarter. Of these, 10 per cent had double-digit house price growth. Suburbs such as Fig Tree Pocket, Samford Valley and Grange had begun to shift from declines to growth.
December 2020: The new peak
By the end of 2020, Greater Brisbane’s median hit a new record high of $616,387. This is $28,000 above the previous record early 2020. House prices have risen modestly over each quarter of the 2020 calendar year, rising a further 0.8 per cent over the December quarter to end the year 5.6 per cent higher than last.
Despite the economic shock of COVID-19, Brisbane’s housing market shone through and came out relatively unscathed. First-home buyers became active utilising incentives and low mortgage rates became the norm. Upsizing buyers were enticed by cheaper credit and altered their wish-lists to think more about property characteristics such as space and lifestyle, rather than commute time and distance to the CBD. The rising interest from interstate buyers and the movement of residents from regional Queensland into Greater Brisbane will continue to support demand. Outer suburban and lifestyle areas will be the main beneficiaries.
By December 2020, 85 per cent of Brisbane suburbs mapped recorded annual growth. Double-digit percentage price rises were notched across 17 per cent of the mapped suburbs. In Brisbane’s north 88 per cent of suburbs increased in price, 86 per cent in Brisbane’s west and 85 per cent in Bayside South. In Bayside North and Brisbane East it was about 80 per cent.
Some of the strongest rates of growth were recorded in Thorneside, Virginia, Highgate Hill, Carina Heights and Yeronga, with house prices surging more than 20 per cent annually.
Despite most suburbs prospering across Brisbane, 15 per cent of suburbs recorded a fall in the median house price by December 2020. The deepest fall of 8 per cent was in Ormiston and Burpengary East.
House prices are on the rise. Find out the value of your property now.
Get a free online property report from Hicks Real Estate. It takes seconds.


